
On this page 7
Key takeaways
- Each calculator answers one specific question: average cost (DCA), profit per grid after fees (grid), whether a subscription pays off (bot ROI), and how returns compound (ROI).
- They use scenario models and random price paths, not live data, so they show behaviour and costs rather than predictions.
- The most reliable outputs are cost-based: fee break-even, capital per order and break-even capital. They hold whatever the market does.
Most crypto trading calculators online either assume a return and multiply it, or replay one cherry-picked period of bitcoin history. Neither tells you much about the decision in front of you. We built these tools to answer narrower questions honestly: what does a strategy cost, where does it break even, and how does it behave when the market does something you did not plan for?
The crypto trading calculators
Crypto DCA calculator
What would buying a fixed amount every week or month have cost me on average, and how does that compare with investing everything on day one?
Average cost, coins bought, DCA vs lump sum
Open the calculator →Grid bot profit calculator
How much does each grid earn after fees, how much capital sits on each order, and how does the bot behave when price chops or breaks out?
Profit per grid, fee break-even, market simulator
Open the calculator →Trading bot ROI calculator
Will a paid bot subscription pay for itself, and how much capital do I need before fees and the monthly plan stop eating the profit?
Fee drag, subscription cost, break-even capital
Open the calculator →The fourth tool, a compound ROI calculator, sits further down this page. It is the simplest of the set and the one most worth sanity-checking any "2% a month" claim against.
Which calculator answers your question?
| Your question | Use | Key output |
|---|---|---|
| Should I buy every month or all at once? | DCA calculator | Average cost, DCA vs lump-sum value |
| How many grids, and is my spacing above fees? | Grid bot calculator | Net profit per grid, round trips |
| Is a $29/month bot worth it on my balance? | Bot ROI calculator | Break-even capital, cost drag |
| What does 2% a month really add up to? | Compound ROI | Final value and net ROI |
If you are deciding whether to automate at all, our guide do AI crypto trading bots work? reviews the evidence first.
How simulations differ from backtests
A backtest runs a strategy on real historical prices. It is precise about one path, the one that actually happened, and that is its weakness. With enough tweaking, almost any strategy can be made to look brilliant on past data. Traders call this overfitting, and it is the main reason live results disappoint.
A simulation generates many plausible price paths with properties you choose, such as volatility or a bull, bear or sideways drift, and runs the strategy on each. It cannot tell you what bitcoin will do, but it shows how a strategy reacts to conditions: how often a grid range breaks, how much a DCA plan's average cost moves, how fees scale with trade count. Press the reseed button on our tools a few times and you see the spread of outcomes, which is the honest answer.
A forecast is neither. None of these tools forecasts prices, and you should be wary of any tool that claims to.
Compound ROI calculator
Enter starting capital, a monthly top-up, an average monthly return and monthly costs. The tool compounds month by month and shows what you put in against what you would have. Try it with honest numbers. A 2% monthly return sounds modest but compounds to about 27% a year before costs, a result most professional funds would be pleased with. Raise costs to 0.5% or 1% a month and watch how much they take.
Compound ROI calculator
Runs in your browserReturns are an assumption you set, not a forecast. No bot can promise a monthly return.
The return slider goes negative for a reason. Real strategies have losing months, and a few bad months early on change the end result more than a good month late. If you want subscription and trade-fee costs modelled separately, use the trading bot ROI calculator instead.
Run the numbers, then pick a venue you can check
Calculators help you size a plan. The coins still need a home. CEX.IO has operated since 2013 and publishes its registrations: a FinCEN-registered MSB with money transmitter licences in 39 US states plus DC, and FCA registration in the UK. It has no built-in bots, so it suits buying and holding the part of your plan that is not actively traded.
Registrations checked October 2026 on the company's legal pages. Availability depends on your country; crypto is high-risk.
- Since 2013One of the longest-running crypto exchanges still operating
source - 39 US states + DCFinCEN-registered MSB with state money transmitter licences (NMLS 1804170)
source - FCA-registeredUK cryptoasset business under the MLRs, FRN 1007192
source - PCI DSS Level 1Card-payment security standard, 2026 certificate published
source
How to use calculator results well
- Trust costs more than returns. Fees, subscriptions and break-even capital are facts of the setup. Returns are your assumption.
- Run the bad case first. Pick the bear or crash scenario, a negative monthly return, or a range the price escapes. If the plan survives that, the good case takes care of itself.
- Change one input at a time. Otherwise you will not know which assumption drives the result.
- Reseed several times. One random path is an anecdote. Ten paths give you a feel for the range of outcomes.
- Write down your inputs. Then compare them with what actually happens after a month of real or paper trading.
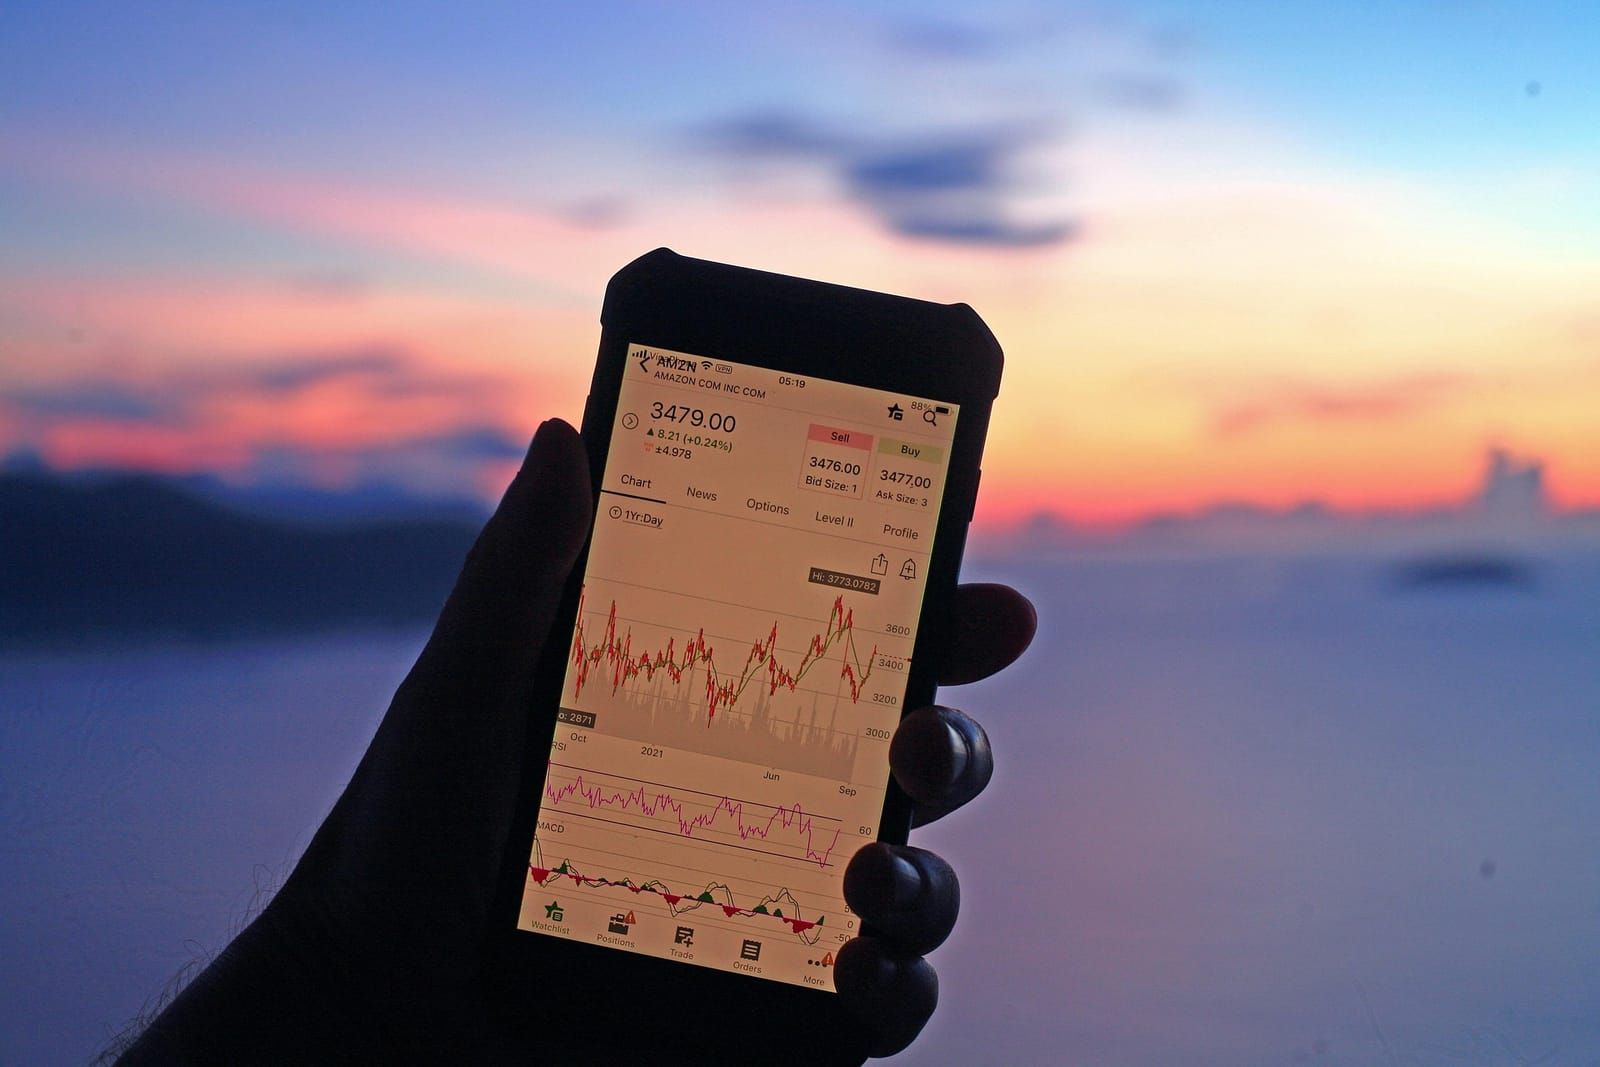
The regulator line is worth repeating: the US CFTC warns that AI will not turn trading bots into money machines, and that promises of large or guaranteed returns are a red flag. A calculator that shows you where a strategy loses money is more useful than one that only shows the upside. For bot choices once the numbers make sense, see the grid trading bots guide, the DCA bots comparison our list of free AI crypto trading bots and the overall ranking of the best AI crypto trading bots. Nothing here is financial advice.
Frequently asked questions
Are these crypto calculators free?
Yes. All four calculators run entirely in your browser. There is no sign-up, nothing is sent to a server, and you can change any input as often as you like. Bookmark the page you use most; the inputs reset when you reload.
Do the calculators use real historical prices?
No. The DCA and grid tools generate random price paths shaped by a scenario or volatility level you pick, and the ROI tools compound a return you enter. That is deliberate: it shows how a strategy behaves across many possible paths instead of one lucky slice of history. For real-data backtests use a backtesting framework such as Freqtrade.
Can a calculator tell me how much a bot will make?
No tool can. A calculator shows the consequences of assumptions: if the market moves like this and fees are that, here is the result. The useful outputs are break-even points and costs, which do not depend on predicting the market. Treat any return figure as a what-if, never as a forecast.
What is the difference between a simulation and a backtest?
A backtest replays a strategy on real historical prices, so it is realistic about one past path but easy to overfit. A simulation runs the strategy on many made-up paths with chosen properties, so it is better for understanding behaviour and risk but says nothing about any specific coin. Use both, and trust neither blindly.
Which calculator should I start with?
If you are investing for the long term, start with the DCA calculator. If you are considering a grid bot, use the grid bot profit calculator to check fees against grid spacing. If you are about to pay for a bot subscription, run the bot ROI calculator first.
Keep reading
Sources and fact-check dates
We link to primary sources wherever possible. Dates show when the page was published or when we last checked it.
- CFTC advisory: AI Won't Turn Trading Bots into Money Machines · checked 2026-10-21
- Freqtrade documentation (backtesting and dry-run) · checked 2026-10-21
